
Clarisights
clarisights.com/
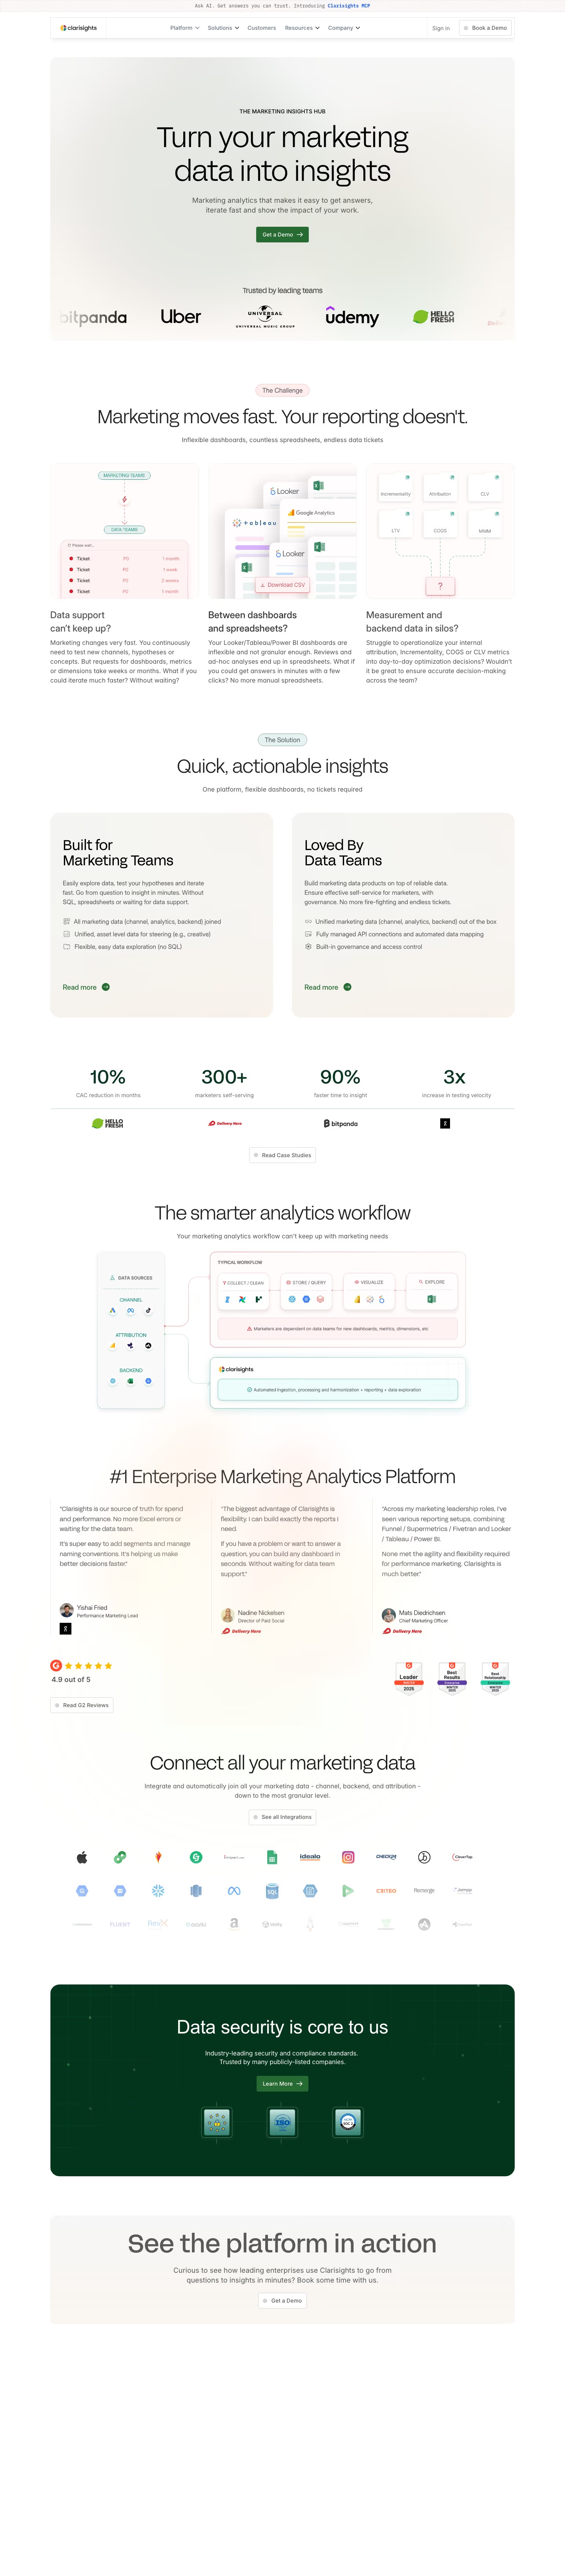
Clarisights unifies marketing channel data, backend systems, and attribution tools into self-service dashboards so marketers can test hypotheses without waiting on a data team or writing SQL. The homepage opens by naming three specific frustrations verbatim as headers — "Data support can't keep up?", "Between dashboards and spreadsheets?", "Measurement and backend data in silos?" — before pairing each with a feature. It splits its pitch into two separate tracks, one for marketers and one for data teams, rather than a single generic value prop. Proof comes from named customer results: HelloFresh's 10% CAC reduction, Delivery Hero's "300+ marketers self-serving," and On Running's "3x increase in testing velocity," alongside a 4.9/5 G2 rating.
- Category
- Data & Analytics
- Style
- LightMinimal
- Stack
- Framer
- Fonts
- FFF Acid Grotesk LightFFF Acid Grotesk RegularIBM Plex MonoInter
- Palette
- Meta title
- Clarisights | The Marketing Insights Hub for Enterprises
- Sections
- 5
- Updated
Clarisights's landing page, section by section
Each section below is cropped straight from Clarisights's live page — useful references for data & analytics landing page design.
Clarisights design review: how the homepage is built
The page runs 6567 pixels top to bottom on a white and warm off-white ground, with deep green #266b31 as the single action colour on the Get a Demo buttons and the dark security band. A teal #098477 outline marks the Clarisights box in the workflow diagram. The display face is FFF Acid Grotesk, with IBM Plex Mono in the top banner and Inter for body copy. Blocks run hero, challenge, solution, stats, workflow, testimonials, integrations, security and a closing band. The distinctive choice is a stacked diagram that sets a typical workflow against the Clarisights box beneath it.
Above the fold
A thin banner reads "Ask AI. Get answers you can trust. Introducing Clarisights MCP" above a bordered nav with "Platform", "Solutions", "Customers", "Resources" and "Company", plus "Sign in" and "Book a Demo". The hero shows the badge "THE MARKETING INSIGHTS HUB", the headline "Turn your marketing data into insights" and the subhead "Marketing analytics that makes it easy to get answers, iterate fast and show the impact of your work." A logo strip sits under "Trusted by leading teams".
Challenge and solution cards
A pale "The Challenge" tag sits above "Marketing moves fast. Your reporting doesn't.", followed by three illustrated cards titled "Data support can't keep up?", "Between dashboards and spreadsheets?" and "Measurement and backend data in silos?". Below, "The Solution" heads "Quick, actionable insights" over two tinted cards, "Built for Marketing Teams" and "Loved By Data Teams", each with three bulleted lines and a "Read more" link.
Stat row and workflow diagram
A row of four large figures follows: "10%" with "CAC reduction in months", "300+" with "marketers self-serving", "90%" with "faster time to insight" and "3x" with "increase in testing velocity". Then "The smarter analytics workflow" introduces a diagram with a column of data sources, a red-tinted "TYPICAL WORKFLOW" box of four steps, and a teal box reading "Automated ingestion, processing and harmonization + reporting + data exploration".
Testimonials and closing bands
Testimonials sit under "#1 Enterprise Marketing Analytics Platform": three quote cards, the first reading "Clarisights is our source of truth for spend and performance." beside a G2 rating of "4.9 out of 5". An integrations block headed "Connect all your marketing data" with a logo row. The page closes on a dark green band, "Data security is core to us", with "Learn More", then a light band reading "See the platform in action".
On mobile
At 390px the navigation becomes a menu icon and the hero keeps its badge, headline and green button in one narrow column. The challenge cards stack into single full-width columns with their illustrations kept, and the stats become a vertical list with a logo under each figure. The footer groups links under "PLATFORM", "SOLUTIONS", "INDUSTRIES", "RESOURCES" and "COMPANY" in green uppercase, below a "Book a Demo" button.
Worth borrowing
- Each stat figure sits above a customer logo, so every number carries its own proof point.
- The diagram contrasts a red-tinted typical workflow with a teal Clarisights box beneath it.
- A single dark green band reserves the page's heaviest colour for security proof.





