Statsig
statsig.com/
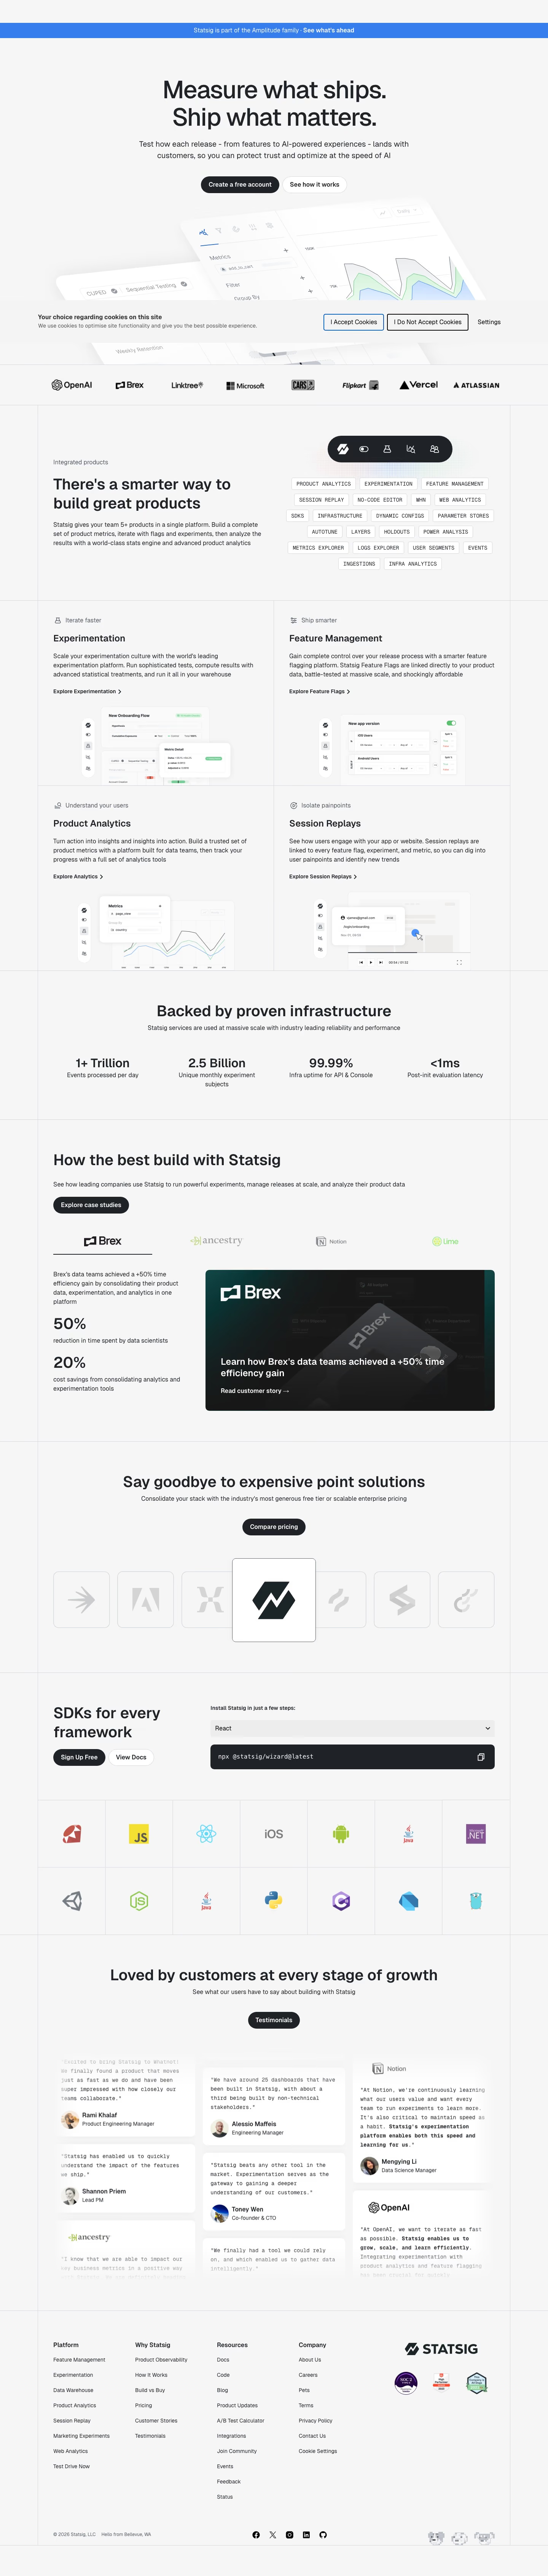
Statsig is a product development platform combining A/B testing, feature flags, product analytics, session replay, and web analytics into one system, positioned against maintaining separate tools for each. The homepage headline "Measure what ships. Ship what matters" is followed by infrastructure-scale figures — over 1 trillion events processed daily and 2.5 billion unique monthly experiment subjects — rather than customer-count claims alone. Its customer proof section pairs specific named companies with specific outcomes instead of generic quotes: Ancestry says its experimentation velocity grew from 70 to over 600 annual experiments, and Notion cites a 30x velocity increase alongside 600+ features released, giving each logo a distinct, checkable number rather than interchangeable praise.
- Category
- Data & Analytics
- Style
- LightColorful
- Fonts
- Geistgeist
- Palette
- Meta title
- Statsig | The modern product development platform
- Sections
- 8
- Updated
Statsig's landing page, section by section
Each section below is cropped straight from Statsig's live page — useful references for data & analytics landing page design.
Heroes
More heroesPricing
More pricingAbout Us
More about usContact Us
More contact usAffiliate pages
More affiliate pagesCareers pages
More careers pagesBlog pages
More blog pagesStatsig design review: how the homepage is built
The Statsig homepage runs 6338 pixels on desktop as hairline-ruled bands inside a narrow bordered column: blue announcement strip, centered two-line hero, logo row, product intro, two-by-two product grid, stat row, case study, pricing call, SDK grid, testimonial wall and four-column footer. The palette is an off-white ground with near-black ink and buttons, and the blue strip is the only saturated colour. Headings use a tight grotesque sans, while tags, install commands and testimonial quotes switch to monospace, giving an editorial layout a developer-tool register.
Announcement strip, hero and logo row
A full-width blue strip carries the link "See what's ahead". The centered two-line headline is set very large in near-black, with a two-line subhead beneath. Two pill buttons sit side by side: a filled dark "Create a free account" and an outlined "See how it works". A row of eight customer wordmarks follows, from OpenAI and Brex to Atlassian, Decathlon, Milwaukee and Riot Games.
Product intro, four-product grid and stats
The heading "There's a smarter way to build great products" sits beside outlined monospace tags such as Autotune, Holdouts and Infra Analytics. A hairline-divided two-by-two grid gives each product an icon kicker, bold title and link: "Experimentation" under "Iterate faster", "Feature Management" under "Ship smarter", "Product Analytics" and "Session Replays". "Backed by proven infrastructure" then shows four centered figures in one row: "1+ Trillion", "2.5 Billion", "99.99%" and "<1ms", each with a one-line caption.
Case study, pricing call and SDK grid
"How the best build with Statsig" pairs two left-aligned figures, "50%" and "20%", with a dark teal Brex card and a "Read customer story" link. "Say goodbye to expensive point solutions" follows with one dark "Compare pricing" pill. "SDKs for every framework" splits into a heading with "Sign Up Free" and "View Docs" buttons, and a React dropdown above a dark code block holding an npx command, over a seven-column, two-row grid of fourteen language logos.
Testimonial wall and footer
A "Testimonials" pill introduces a three-column masonry of monospace quotes with avatars, names and titles, such as Wendy Jiao at Notion, with Whatnot and OpenAI logos among the cards. There is no separate closing banner. The footer has four link columns, "Platform", "Why Statsig", "Resources" and "Company", with Platform the longest at eight links ending in "Test Drive Now". A large STATSIG wordmark sits above three compliance badges.
On mobile
At 390 pixels the page grows to 7245 pixels. The hero buttons stack full-width, with "Contact Us" as the filled dark pill above an outlined "Create a free account", reversing the desktop pairing. The logo row shows three marks per screen, the product tags wrap into centered rows, and the product grid becomes a single column. Stats fall into a two-by-two block.
Worth borrowing
- A single saturated blue strip on a grey-and-black page makes the announcement the first thing read without a second accent.
- Setting tags, install commands and testimonials in monospace against grotesque headings signals engineering credibility on a marketing page.
- Placing a four-figure stat row before the single named customer result lets scale claims set up the specific proof.